What Is a Doji Candle? How to Read this Pattern
What Is a Doji Candle? How to Read this Pattern
See a doji candle on your chart? Learn what it means, explore the main types, and understand how traders interpret its signals.
 Quick Answer
Normal candlesticks on charts show distinct layers that show the gap between open and close prices; a doji candlestick, on the other hand, forms when there is little or no difference between the asset’s opening and closing price.
Major Takeaways
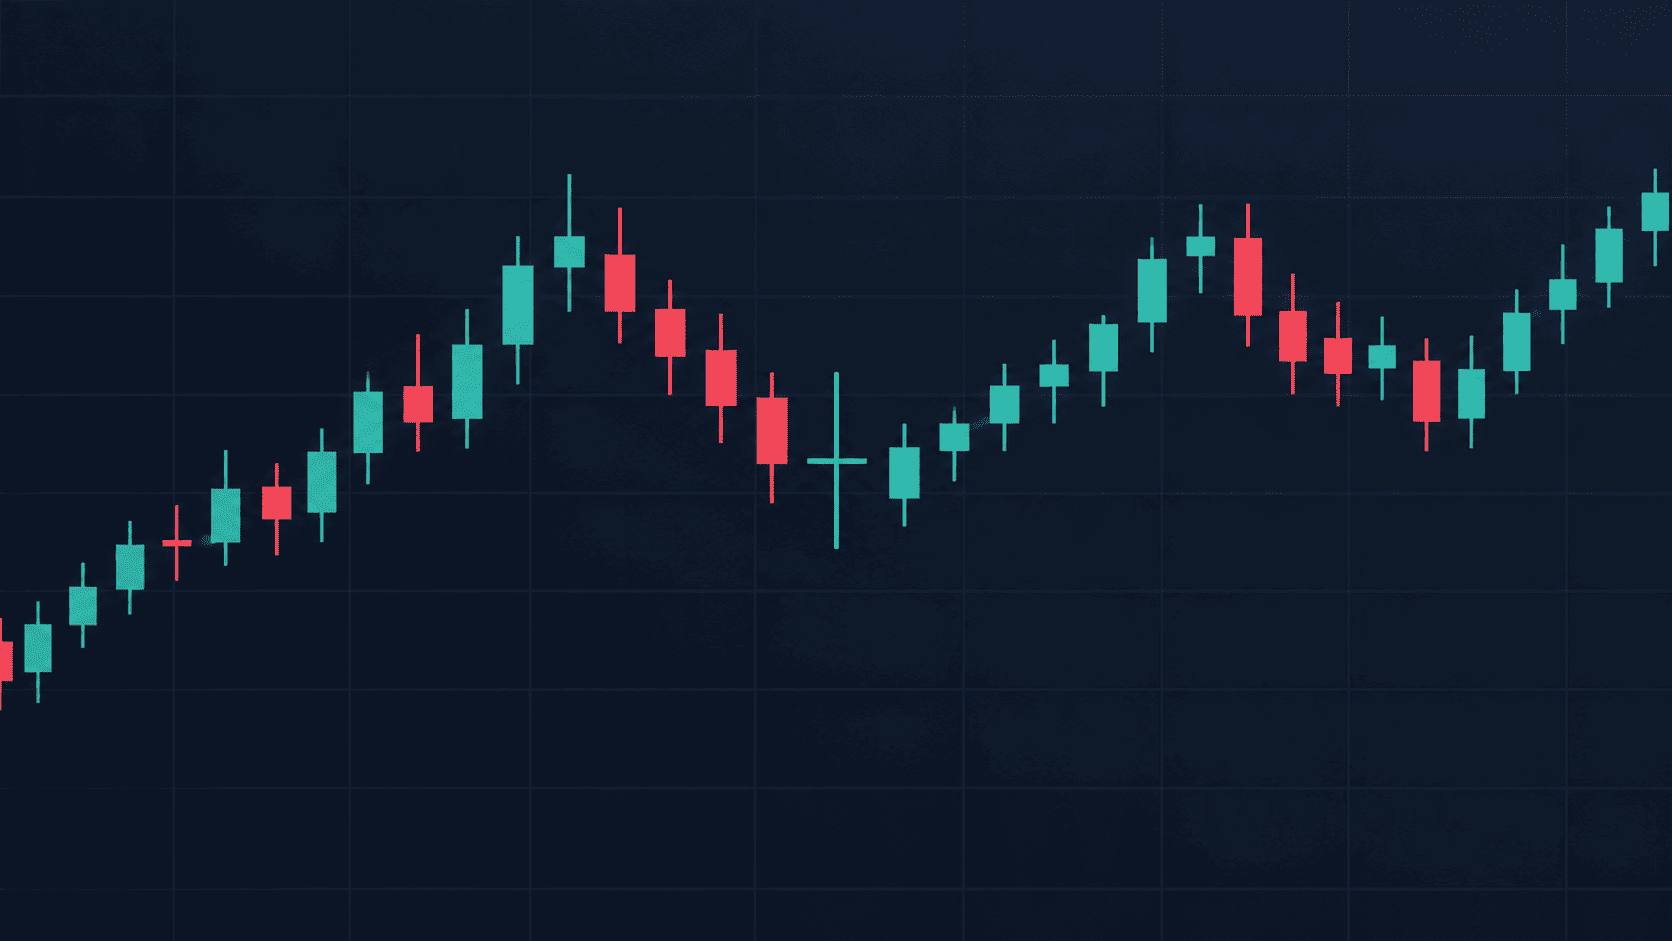
A doji candle bullish or bearish has a unique shape on the chart: a thin horizontal line with vertical lines above and below it.
A dragonfly doji candle suggests a reversal of an asset’s price in a bullish manner.
A gravestone doji candle suggests a reversal of an asset’s price in a bearish manner.
There is no definite list of what occurs next after the appearance of a doji candle.
What Is a Doji Candle?
A doji Candle reflects a temporary balance between buying and selling pressure at the end of a candlestick session. Unlike the typical rectangular bodies of positive and negative candlesticks, a doji candle has something close to a cross shape, signifying a relatively neutral market. The body is minimal or absent when measured against the distance between the high and low, while the wicks indicate the price movements above and below the body before the trading session ended.
For better understanding or as a quick recap, check the basics of candlestick reading.
Imagine Solana opens at $100, and buyers push the price up to $130, while sellers push the price down to $90, then the price recovers and closes at $102. So even though the price shifted significantly, the opening and closing prices are almost the same. A doji candle is by no means a trading signal and should be interpreted with context. It cannot confirm what the next market movement will be like.
Doji Candle Types: Gravestone, Dragonfly, and More
Standard Doji: Also known as a classic doji, this appears as a cross shape with the both shadows at roughly the same length, with an invisible body. It is the clearest sign of market indecision, although it could be seen as the dominant side losing strength and the opposing side gaining momentum in the coming trades. People hardly trade it in isolation; other confirmations are needed.
Long-Legged Doji: With its long upper and lower shadows and tiny body, a long-legged doji shows significant volatility in the market. When traders see this, it is assumed that price traveled far in opposite directions before returning to the starting point. A positive interpretation would be that it can also signal that a significant decision would soon be made.
Dragonfly Doji: A dragonfly doji candle occurs when the open, high, and close are at or near the same level, with a long lower wick; as usual, there is a standoff. Sellers bring down the price, triggering a price rejection from the buyers, so the final price still remains the same at the end of the session. When this T-shaped pattern emerges after a fall, it could be interpreted as a potentially bullish signal, even though the price can continue in its original direction.
Gravestone Doji: It is well known the similarities exist between the gravestone Doji candle and the dragonfly Doji Candle (open, low, and close near the same level), but this has an inverted T figure on the chart. The standoff consists of buyers raising the price, but sellers ultimately rejecting it, so the price was still at the same spot.
How to Trade Doji Candles: Real Chart Examples
A doji should be viewed in the context of a process, and not as a buy or sell. Here are the steps for considering how to trade a doji candle:
Check the trend before the doji.
Record if it is close to support or resistance, as this provides context to the pattern.
Look for confirmation or rejection on later price action.
Before thinking about a position, determine the level of invalidation and risk. The invalidation level is placed outside of the doji's wick: below the low for the bull market; above the high for the bear market.
Hypothetical Bullish Setup: After a decline, price reaches a support level and a dragonfly doji forms. If the trend moves back up, a later close above the doji’s high would provide more support for buying pressure. Should the price move down and break the bottom of the doji, the setup is invalidated.
Hypothetical Bearish Setup: After an advance, price reaches a resistance area and a gravestone doji forms. A later close below the doji’s low would support a bearish reading. When the price closes above the doji’s high, the entire setup may be invalidated.
None of these examples are guaranteed profitable trades; in both cases, a doji only shows where to pay attention; actions taken after decide whether the setup would be successful.
Doji Candle Signals and Common Mistakes
Is a doji candle bullish or bearish? Neither. The same shape can mean different things after a sustained move than in a sideways market.
The length of the wick indicates how much movement took place, not where it goes next, and the body is too small to indicate direction. Context and volume, along with the next candle, can improve your read.
Risk Management Around Doji Candle Signals
A convincing doji setup can still fail. Have rules as to when you know the setup is not right and size the trade and stop accordingly. Remember that fees, spreads, and slippage will affect the results and that stop orders may get filled at a different price in a fast and/or illiquid market. Use risk controls and always start small.
Position size also must be determined by distance. The wicks on dragonfly and gravestone dojis are long; the invalidation is a great distance away from the entry.
Using XXKK Charts to Spot Doji Candles
Traders can visit the Markets page on XXKK to see crypto price charts and learn how to identify candles with small bodies. Before making a decision, make comparisons of each with the trend and price action surrounding it. Keep in mind that a doji on the short time frame is different from a doji on the daily chart, as it would represent a different period of activity.
Conclusion
A doji candle offers insight into price action within a specific time; it is not a complete forecast for trading. Context, confirmation, and risk management matter.
Create an XXKK account to explore crypto markets.
Check live market data on XXKK before placing trades.
Start with small position sizes and use risk controls.
FAQs
What is a doji candle?
It is a candlestick that closes at or near its opening price, with the real body being very small. Often interpreted as a sign of market indecision.
What are the main types of doji candles?
They are standard doji, long-legged doji, dragonfly doji, and gravestone doji.
What does a doji candle indicate?
It shows market neutrality, with the price ending up roughly where it started.
Is a doji candle bullish or bearish?
In isolation, a doji is generally neutral. Context and other data can aid both readings.
