Bull Trap Explained: Why Breakouts Fail and How to Spot One
Bull Trap Explained: Why Breakouts Fail and How to Spot One
Learn what a bull trap is, why false breakouts happen, how to spot failed breakouts, and the difference between bull traps and bear traps.
Quick Answer: A bull trap is a false breakout where price moves above resistance before reversing and falling back below the breakout level. Traders always watch volume, price closes, retests and broader market conditions to know whether a breakout has sustained momentum. Key Takeaways: A bull trap happens when an upward breakout fails. Weak volume and rejection around resistance can lead to a false breakout. Price returning below the breakout level weakens the original bullish setup. A bull trap and bear trap are opposite types of failed breakouts. Know how to define your invalidation level before entering a breakout trade. Breakouts tend to draw attention because they show that price has gone beyond a significant resistance level, though in crypto markets some breakouts fail shortly after they have started. A bull trap is just one example. The price rises above the area of resistance, traders enter with the expectation of more gains and then the market turns around. Traders who entered late will end up with losing their positions since the price moves back below the level of the breakout. If you understand how a bull trap develops and can identify signs such as a rapid price reversal and low volume, you will be able to deal with these market scenarios more disciplined and will feel more confident in your analysis. A bull trap occurs when the price moves above a resistance level and gives the impression of a rising trend, only for the price to turn around and drop back below the area of the breakout. For example, imagine Bitcoin keeps on having difficulty rising above $60,000. If the price move above $60,000 and make it to $61,000. The traders see this rise as a breakout and begin to buy. The price then drop back below $60,000 and keep going lower, the breakout would have failed. Traders who had bought into the first move might find themselves trapped in positions that they opened near the high. A bull trap is also referred to as a false breakout. It is helpful to first get a basic understanding of price charts, have a look at XXKK article for beginners on Candlestick Chart Basics. This article gives a better understanding you need to know about price charts. Bull traps may form as a result of many reasons. One factor is liquidity, a resistance level tends to draw a great deal of attention from numerous traders, some of whom place buy orders at that level while others maintain short positions with stop-loss orders above it. Market liquidity is another factor, if a market has little liquidity, even small orders can cause big price changes. Additional factor is the lack of participation in breakouts; a rise in price above resistance, together with heavy trading volume and ongoing buying interest, is quite different from a short-lived move above resistance after which trading activity has declined. News and market sentiment also have an effect on breakouts; a positive headline may cause a quick rise in price, but the move can disappear if buyers don't keep entering the market. The expression "stop hunt" is frequently used by traders to refer to instances when the price moves into areas that include clusters of stop orders before then reversing. Yet merely because a breakout has failed does not prove that there has been deliberate manipulation or a coordinated effort to trigger the stops. Attention should be given to the price and volume once the breakout has occurred. No single indicator can confirm every bull trap and traders always look for indications of rapid price reversal after breaking resistance, particularly when volume is low, as this helps to enhance their analysis. This is the clearest type of indication. If the price goes above resistance and then closes again below that same level, the breakout has lost a key aspect of its confirmation. A breakaway that involves weak or falling volume should be looked at more closely. Volume does not guarantee a successful breakout. However, it gives helpful context about participation. The upper wick of the candle is long because the price had reached higher levels during the candle but then fell back down before the candle ended. It may be a sign of selling pressure in the vicinity of the breakout area. Some breakouts will retest the earlier resistance level before moving higher. If the price goes back to the breakout area and is unable to maintain it as support, then the original breakout becomes less convincing. It's easier to doubt a breakout when the wider market is weak. For instance, a single token that is rising when the broader crypto market is falling would warrant a more thorough examination. It's easier to understand what a bull trap is and what a bear trap is if you view them as opposite examples of failed breakouts. A bull trap happens when a price seems to break out upward but then reverses and fails. A bear trap occurs when an apparent downward breakout does not happen. For a bull trap: Resistance is broken so that traders anticipate further gains which causes the price to reverse and then fall back below the resistance. For a bear trap: When support level is broken, traders always anticipate further falls, causing the price to reverse and then move back above the support level. Traders can also find themselves trapped in both cases when they enter a trade, believing that the breakout will continue. A bear flag may also cause confusion since traders could interpret a downward continuation pattern in a different way from a failed break of support. A bear flag breakdown is when the price breaks below the lower boundary of a bear flag pattern and a bull trap specifically involves a failed upward breakout. A quick breakout is possible, particularly in crypto markets that are volatile. Before you carry out a breakout trade, understand the level at which your initial setup ceases to be valid. Other practical considerations include: Do not enter a trade just because the candle momentarily moves above resistance. Treat the breakout as confirmed only after checking the volume. Observe the way the price moves during a retest. Make sure that the size of your positions is appropriate for your trading plan. Set an invalidation level before you enter. You should not change your exit level just because the trade is moving against you. The need to compare price, volume and market structure arises if you want to study the bahaviour of breakout. You can take a look at XXKK Markets guide and see how various cryptocurrencies act around significant price levels. When studying a potential breakout, there are some key elements you need to look at for: The last previous level at which resistance or support occurred. The volume of trading during the breakout. The price movement after the breakout. Retesting the breakout area. Broader market direction. Market depth and available liquidity. Do not consider a single candle or indicator as evidence that a breakout has been successful. You can create an XXKK account if you are ready to monitor the crypto markets on live charts. A bull trap happens when an upward breakout does not continue as expected and the price then falls back below the breakout area. Such situations usually arise at significant resistance levels since traders are looking for an upward movement. Among the indications that traders usually keep an eye on are weak participation, declining volume, selling pressure and the failure to hold the breakout level. The best method when dealing with a possible breakout is to set your confirmation and invalidation levels before you enter the market. Additionally, checking volume, the price structure and the current market conditions gives you more context than depending just on the breakout. A bull trap simply means a false upward breakout, since the price rises above resistance, draws in buyers and then turns around to fall below the level of the breakout. Look for a break upwards that soon collapses, with weak or declining volume, a rejection close to resistance and the price then moving back below the level of the breakout. Bull traps may occur due to weak buying demand, a change in market sentiment, liquidity conditions, profit-taking and the presence of stop-order activity at key price levels. A bull trap occurs after an attempt to break upwards above resistance has failed. A bear trap occurs after a downward breakout below support has failed. Although bull traps can catch buyers, bear traps can catch sellers too.What Is a Bull Trap?
Why Bull Traps Form: Liquidity, Stop Hunts, and Thin Breakouts
How to Spot a Bull Trap on a Chart
1. The price breaks through the resistance level but then drops back again.
2. The volume does not support the move.
3. Price leaves an upper wick that is long.
4. The price does not manage to maintain the breakout level.
5. The wider market conditions are in disagreement.
Bull Trap vs Bear Trap: Mirror Images
Managing a Trade When the Breakout Fails
Using XXKK Charts to Confirm a Breakout
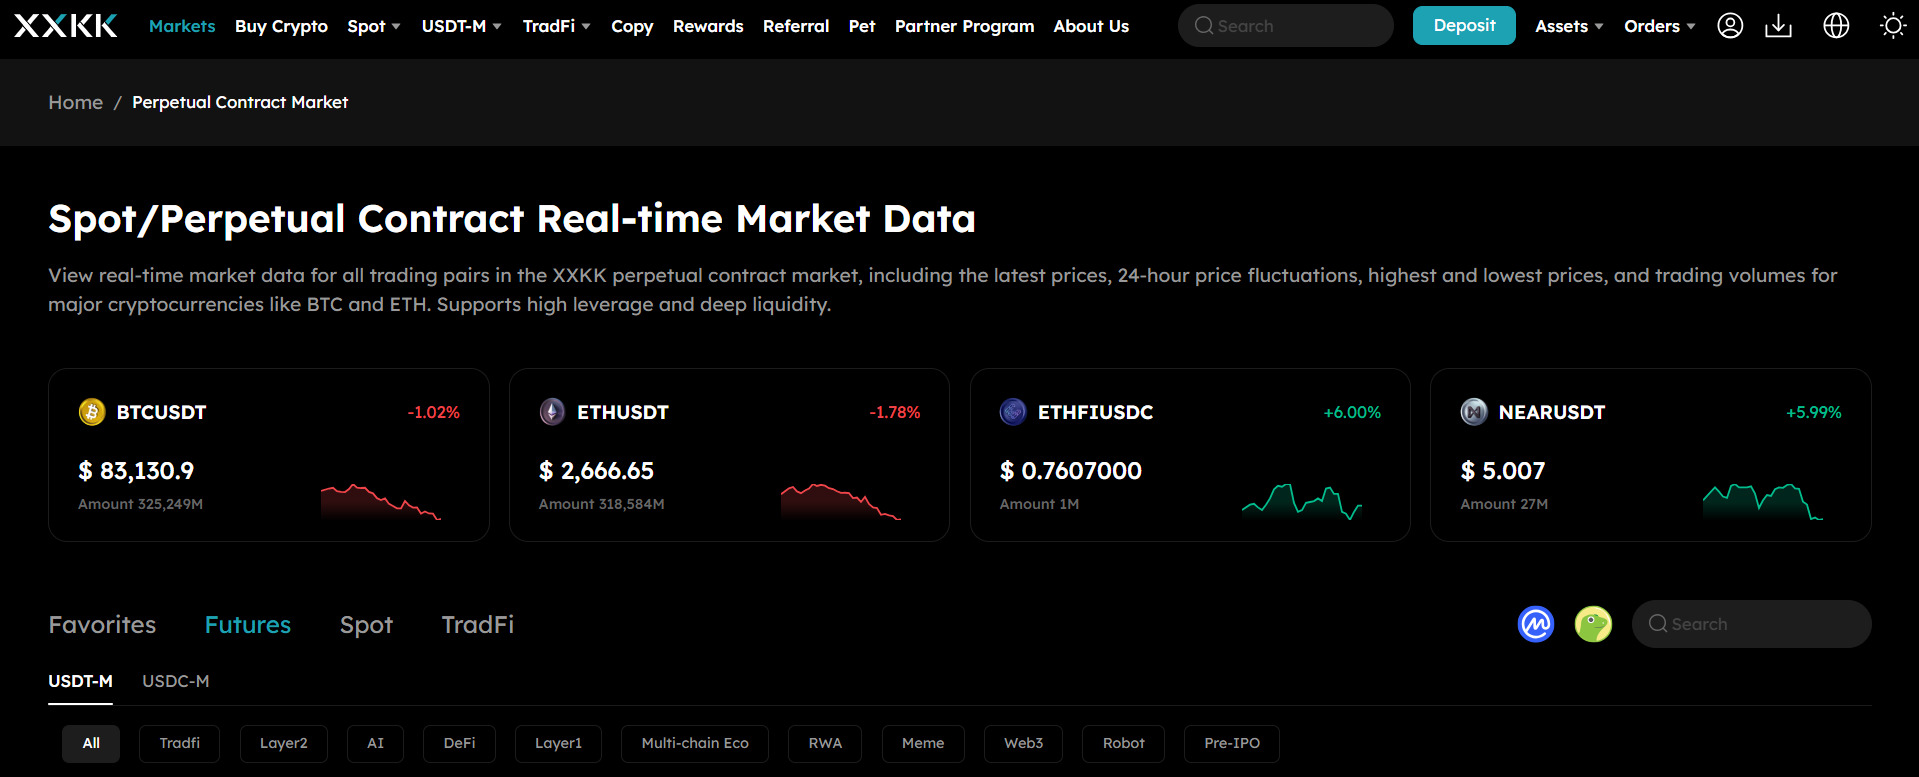 Source: XXKK market page
Conclusion
FAQs
What is a bull trap?
How do you spot a bull trap?
Why do bull traps happen?
What is the difference between a bull trap and a bear trap?
