Fear and Greed Index: What It Measures and How to Read It
The fear and greed index is one number built from several market measures. This guide covers what goes into it, how to read extremes, and its limits.
Quick Answer
The fear and greed index summarizes market sentiment on a scale from 0 to 100 using several measures of market behavior. A crypto fear and greed index may use different data from a stock market version. Low scores describe fear and high scores describe greed, but neither tells you where prices will move next.
the fear and greed index compresses several market measures into a single 0-100 sentiment reading. It is a description of the crowd, not a forecast of price. It is not a valuation model, a measure of your personal risk, or a standalone reason to open or close a position.
Major Takeaways
Each provider chooses its own inputs, so similarly named indexes can describe different markets.
Price movements can influence sentiment scores, making the index partly a summary of recent conditions.
Extreme fear and extreme greed can persist without establishing when a trend will reverse.
Comparing sentiment with price and volume adds context without making the measures independent evidence.
What the Index Actually Measures
The index translates observable market activity into a label about collective behavior. It does not read every participant's emotions. Instead, its provider interprets selected data as evidence of stronger demand for risk or greater demand for protection.
That distinction matters when a headline calls the market fearful. Falling prices, increased demand for protection, and weaker participation can contribute to that description. They do not establish why every holder traded, whether an asset is fairly valued, or whether the next session will recover.
There is also no single universal version. CNN's gauge concerns the U.S. stock market. Alternative.me's methodology identifies Bitcoin as the focus of its current crypto measure. A headline about one should not be treated as a direct measurement of the other. First identify the provider and the assets its inputs actually represent.
The Inputs Behind the Score
Individual components cover different aspects of participation and demand for risk or protection. A provider may compare price trends, the breadth of a market move, or demand for defensive positions. Combining those observations broadens the description, but their inclusion does not make the gauge a measure of every stock or every investor.
Volatility also needs careful interpretation. A measure of how widely prices fluctuate answers a different question from whether a market is advancing or declining. Expected movement is different from a prediction that prices will fall. A component's meaning depends on what it measures and how the index provider uses it.
Historical reference periods help put volatility and momentum into context. A change can appear large against a quiet period and less unusual against a turbulent one. Check what period a provider uses before comparing its score with another gauge. Changes to the inputs also matter: a discontinued or paused component should not be described as active.
Calculation generally involves transforming unlike measures into comparable scores, then combining them according to the provider's rules. Raw volume cannot simply be added to a percentage or a search measure. The transformation and aggregation determine what the final number represents. Without those rules, averaging publicly visible raw inputs will not reproduce the official score.
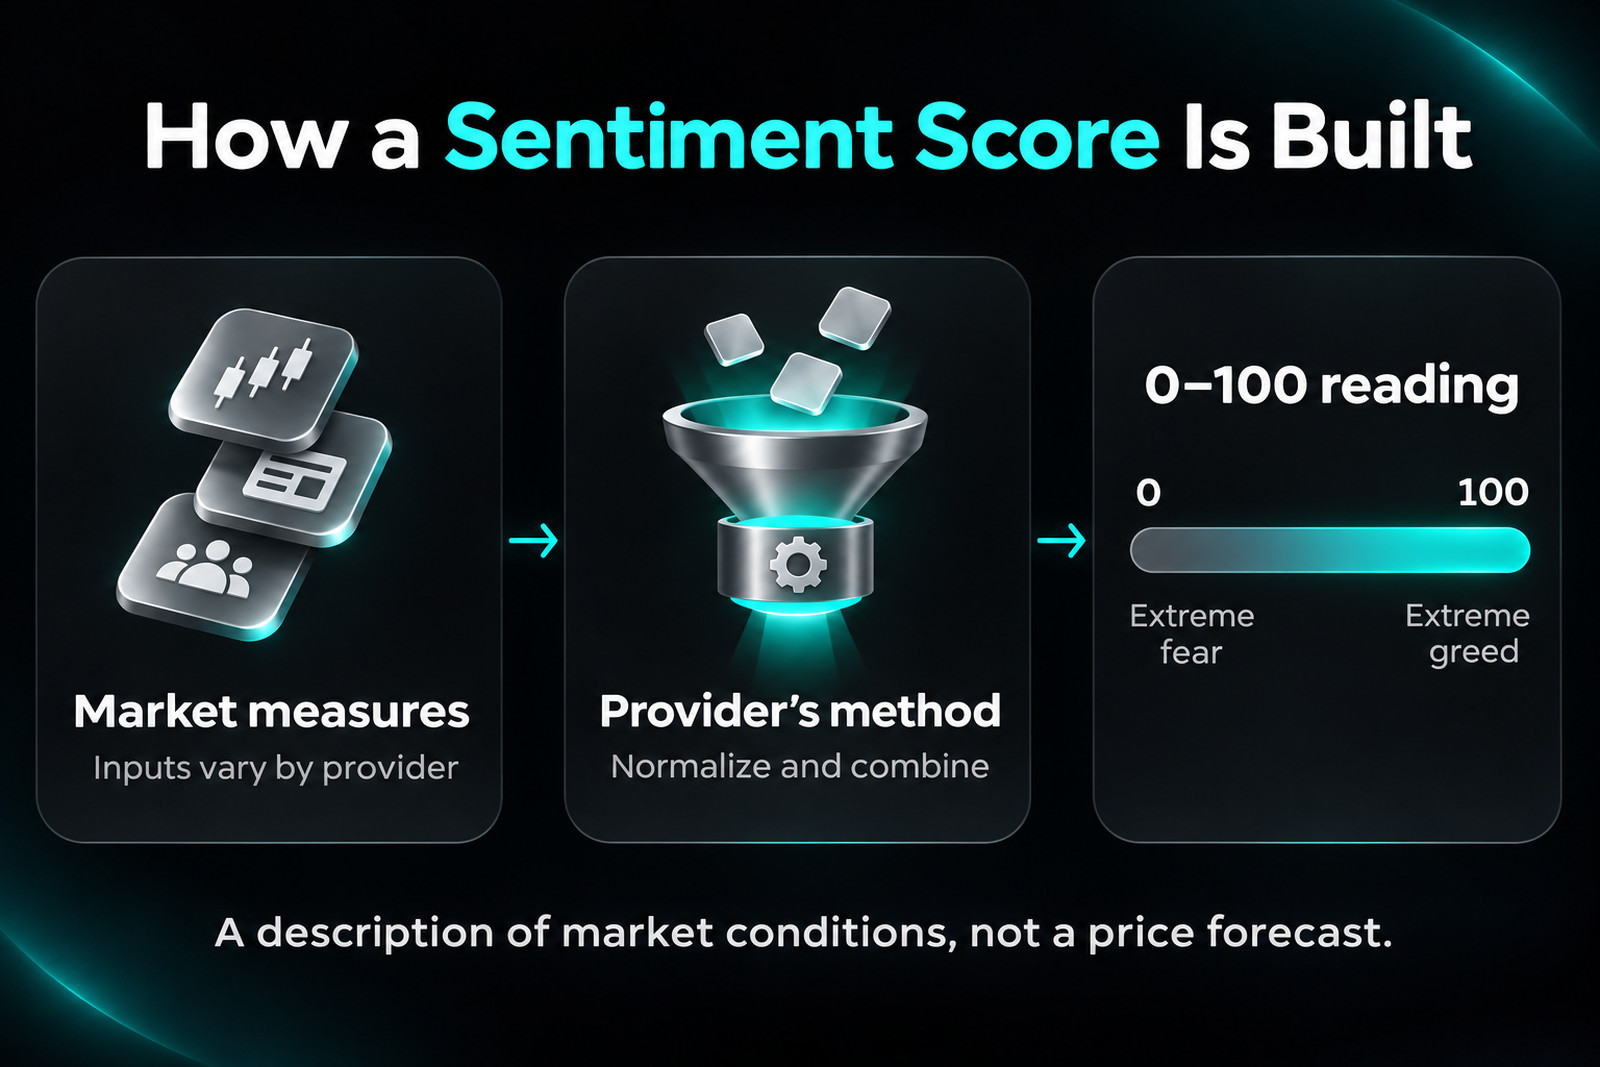 Before comparing two readings, check the market covered, update time, reference periods, and methodology changes. A shared 0-100 scale does not establish that two providers assign identical meanings to the same number. Nor does a change of ten points mean that traders became ten percent more fearful.
How Extremes Are Read
Extreme readings describe an unusually strong concentration of the conditions a provider associates with fear or greed. Use the provider's own category definitions instead of applying one set of boundaries to every index. The labels summarize the model's interpretation; they are not universal market thresholds.
Extreme fear can accompany continuing deterioration. Selling pressure, uncertainty, and demand for protection may remain elevated across several updates. An asset can become cheaper while the reasons for caution become stronger. The sentiment label alone cannot distinguish temporary stress from a lasting change in fundamentals.
Extreme greed can persist during a sustained advance. Broad participation and strong momentum may keep a score elevated even while prices continue rising. Equally, favorable sentiment cannot prevent an abrupt change in conditions. Neither extreme specifies how much further a move can travel or how long it can last.
The useful follow-up is to ask what produced the reading. A shift driven mostly by price-related inputs deserves a different explanation from one accompanied by wider participation or changing demand for protection. If the provider publishes component details, examine those before assigning a story to the headline number.
Why It Lags and Misleads
Many inputs are based on activity that has already happened. Historical comparisons and smoothing can delay the full effect of a sharp move. Publication timing adds another gap: a score displayed now may summarize an earlier observation period. Always distinguish the time you view the page from the time represented by its data.
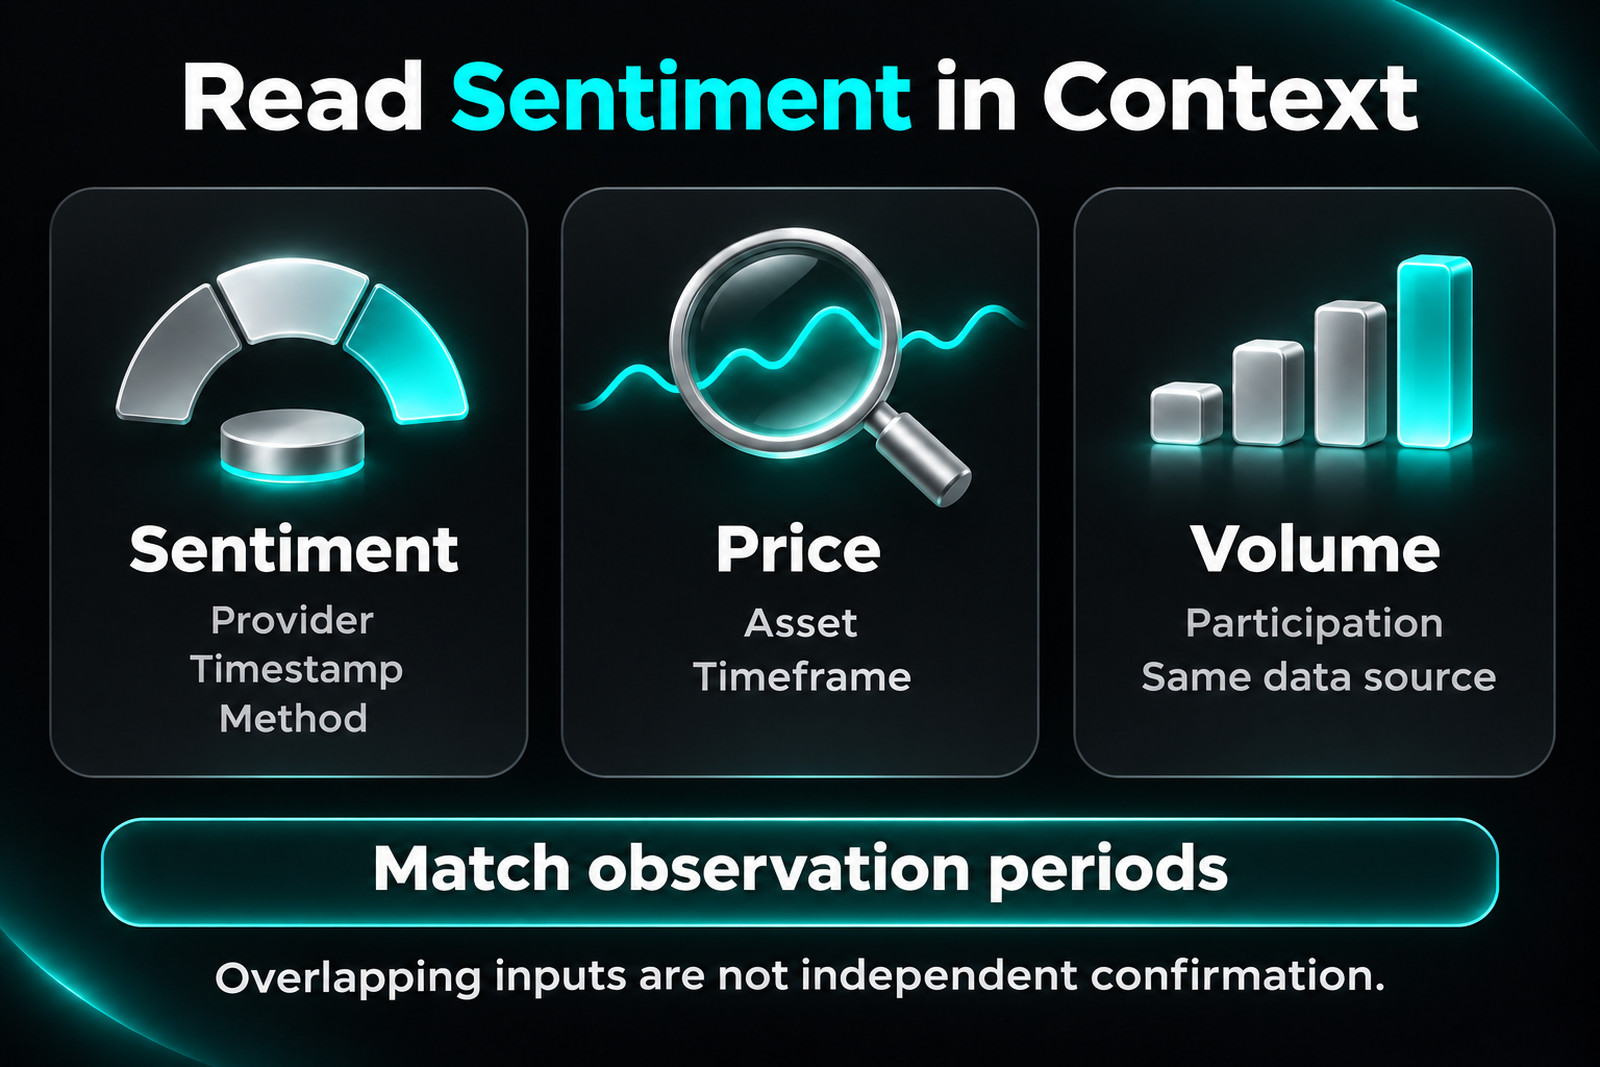
Overlapping inputs can also exaggerate the impression of confirmation. A price decline may affect momentum and volatility together. If both feed the composite, a fearful score and a falling chart partly reflect the same event. Counting them as separate votes can overstate how much additional information you have.
Aggregation hides differences. Components pointing in opposite directions may produce an ordinary-looking total, even though the underlying market is uneven. Two identical headline scores can therefore have different explanations. A change in the combined reading does not tell you which component moved without further inspection.
Coverage is another limitation. A Bitcoin-focused measure cannot describe the liquidity or project-specific risks of every smaller token. Likewise, a broad stock gauge can miss conditions affecting one company. Broader context, including the Crypto Market Outlook 2026, belongs in a separate assessment of market drivers rather than being inferred from a sentiment label.
Using It Alongside Price and Volume
Start with the asset and timeframe relevant to your question. A daily sentiment reading and a short intraday chart describe different observation windows. Compare like periods before interpreting agreement or disagreement. Otherwise, a timing mismatch can look like a meaningful contradiction.
Then describe price behavior directly. Is the asset advancing, declining, or moving within a range? Does the latest move have participation comparable with earlier moves on the same data source? Volume can help describe activity, but its amount alone does not reveal every participant's motive or establish the next direction.
Use XXKK Markets to review market data separately from your chosen index provider. Keep the sentiment reading's source and timestamp in your notes. This makes clear which observations belong to the index and which belong to the asset you are examining, without assuming the platform supplies an integrated sentiment tool.
For execution context, the guide to cryptocurrency spot trading explains trading pairs and order types. A sentiment label does not resolve execution questions such as slippage or whether a limit order will fill. Understanding those mechanics remains necessary even when market mood appears clear.
 A Simple Reading Routine
To review the fear and greed index today, follow a repeatable routine that keeps the number connected to its source:
1. Identify the provider and market coverage. Confirm whether the measure concerns stocks, Bitcoin, or another defined universe.
2. Check the timestamp and update schedule. Match the reading with the period you intend to examine.
3. Inspect the method and available components. Note paused inputs or changes that could affect comparisons.
4. Compare price and volume over a matching period. Record where observations overlap rather than counting them twice.
5. Write a neutral summary. State what the reading describes, what remains unknown, and what additional evidence your assessment needs.
For example, a note might say that sentiment remains fearful while price is moving sideways. That describes a relationship without assuming an imminent rebound. Keeping comparable notes over time also reduces the temptation to reinterpret an old reading after seeing what prices did next.
Conclusion
Read the method, not just the number. The index becomes more useful when you know its coverage, inputs, and observation period. Treat any single indicator as one input, not a verdict. If you choose to open an account, start at XXKK, and keep your sentiment research alongside a separate review of price and volume.
FAQs
What is the fear and greed index?
It is a composite indicator that summarizes selected market measures as a sentiment score, usually on a 0-100 scale. Lower readings describe fear and higher readings describe greed. Its meaning depends on the provider's coverage and method, so it does not represent every asset or identify a future turning point.
What data goes into it?
The inputs depend on the provider and market covered. The label "cnn fear and greed index" refers to a gauge with seven stock market components, covering market momentum, stock price strength, stock price breadth, put and call options, junk bond demand, market volatility, and safe haven demand. Crypto versions can incorporate different data, so check the relevant methodology rather than assuming their inputs match.
How is the score calculated?
The provider transforms its chosen inputs into comparable measures and combines them using its own methodology. The resulting score reflects those design choices, including reference periods and aggregation rules. There is no universal calculation that applies to every similarly named index, and raw public inputs may be insufficient to reproduce a provider's result.
What do extreme readings mean?
They mean the provider's selected measures strongly reflect the conditions it classifies as fear or greed. The label describes the observed market environment within that model. It does not establish that an asset is undervalued or overvalued, and it cannot specify when an existing trend will end.
How should traders use it?
Traders should use the reading as context when reviewing an asset's price behavior and trading volume over a comparable period. Start with the provider, timestamp, and methodology, then examine available component details. Record what the score describes and what it leaves unresolved before considering any separate trading decision.
