Is Crypto in a Bear Market? Signals You Can Actually Check
Is Crypto in a Bear Market? Signals You Can Actually Check
Wondering if crypto is in a bear market? Learn why a simple percentage drop isn't enough, how to cross-reference market breadth and trend signals, and what history (from 2018 and 2022) teaches us about navigating crypto downturns.
Traders look at the unfavorable headlines, and a common question goes through their minds. Is crypto in a bear market? One cannot say for sure based on a single percentage drop. Crypto can decline up to 20% in a week and still be within a longer uptrend. To get a clearer picture, traders also look at price trends, how many major currencies are dropping other than Bitcoin, and what Bitcoin's share of the current market is. Then finally, how much the price actually fell from its previous peak. A lone percentage or indicator doesn't settle bear market crypto questions on its own. Equity markets have a 20% rule, but crypto volatility still makes it unreliable to use to judge. Trend, breadth, dominance, and drawdown have limits even though they offer different insights. A market low can only be clearly defined based on outcome, not while it is happening. The timeline for crypto bear markets varies, with some lasting months, others years. The standard definition usually comes from equities; the SEC investor education glossary describes a bear market as a broad index falling 20% or more over at least two months. While some other platforms say the 20% threshold isn't fixed, it is a more conventional value. Neither source offers a crypto-specific test. This distinction matters because crypto doesn't behave like the typical stock exchange. Bitcoin could fall 20% in a few days and still be inside a broader uptrend. Using depth alone to judge is unreliable. Some sources favor a more sustained downward trend, while others favor sustained trading below a 200-day moving average; there is no universally accepted standard; therefore, no single number settles that question. Although trend structure is easy to deduce, traders tend to overstate it. A downtrend can be read as lower highs and lower lows, with each rebound topping out below the last one. Traders then compare price with its 200-day moving average as a longer-term reference. Breadth, on the other hand, checks whether a move is specific to one asset or distributed across the market; this involves tracking other major assets rather than just Bitcoin, since the latter can still have a bit of stability while the former drops, and vice versa. Dominance is a ratio of Bitcoin market cap divided by the total crypto market cap. On its own, it does not tell the actual value in dollars of Bitcoin. Drawdown is how far price has fallen from a selected peak. It is easy to misuse Drawdown; however, traders should know that the number describes severity, not duration, nor does it describe what comes next. Its usefulness depends on which peak, which trough, and which data source gets used. When the market drops by 10% to 20%, it is known as a correction. A 20% or more drop is conventionally known as a bear market. These definitions are not set in stone; a 20% drop can happen in a week without affecting the broader trend underneath it. A market crash is related to a bear market but deals with speed rather than duration. An article on market crashes covers that distinction. There is no universally accepted meaning of the two terms. Traders cannot tell whether a trough is incoming unless the chart shows it has already occurred. Another term for this is hindsight bias. Part of this concept is just structural, checking data sets backward to classify a market, without knowing exactly when prices started changing. A decline transforming into a sustained bull market is as difficult to pinpoint as the bottom of a bear market. Two classic crypto cycles illustrate the dynamics of a bear market movement. First is the Bitcoin's 2017-2018 downturn, which wiped out more than four-fifths of its market, from $19,424 to around $3,217. The damage did not stop there; the ICO boom was also halted, with 95 of the 100 leading cryptocurrencies falling in value in a single day. Meanwhile, Bitcoin's share of the total crypto market expanded from roughly 37% to 52%. In the 2021-2022 bear market, the value of Bitcoin crashed from $69,045 to $15,742. This could have been said to have occurred due to the earlier TerraUSD crash starting the chain reaction. However, unlike the first event, Bitcoin dominance stayed stable (37.9% to 38.6%). XXKK's market pages are available if you wish to monitor these signals closely. These include Price charts against longer-term moving averages, market capitalization and the portion occupied by each asset, and comparison between the movement of a single coin price relative to the wider market over time. A negative chart only shows a result, not what caused it. Trend, breadth, dominance, and drawdown can answer more questions, although any of them read alone is still unreliable. Traders also look at their own position size, leverage, and how much liquidity they want to have. Keep in mind that a single unfavorable signal doesn't mean a cycle is finished. Open an XXKK account to check market conditions with real data. Review your position and margin settings on XXKK before volatility expands. Reduce leverage in downtrends rather than averaging down on hope. There is no universal crypto definition. Equity markets frequently refer to a 20% decline over a minimum of two months, but crypto sources prefer a sustained move or trend for an extended period or trade below a long-term moving average. Trend structure, breadth across majors, Bitcoin dominance, and drawdown from a stated peak. It depends on the definition and episode. Based on CoinGecko’s rule, 385 days for 2018-2019 and 381 for 2022-2023. In traditional markets, they think of a move of 10% as a correction and 20% as a bear market. Crypto doesn't really work that way, though; a 20% move can occur within a week, within a longer uptrend.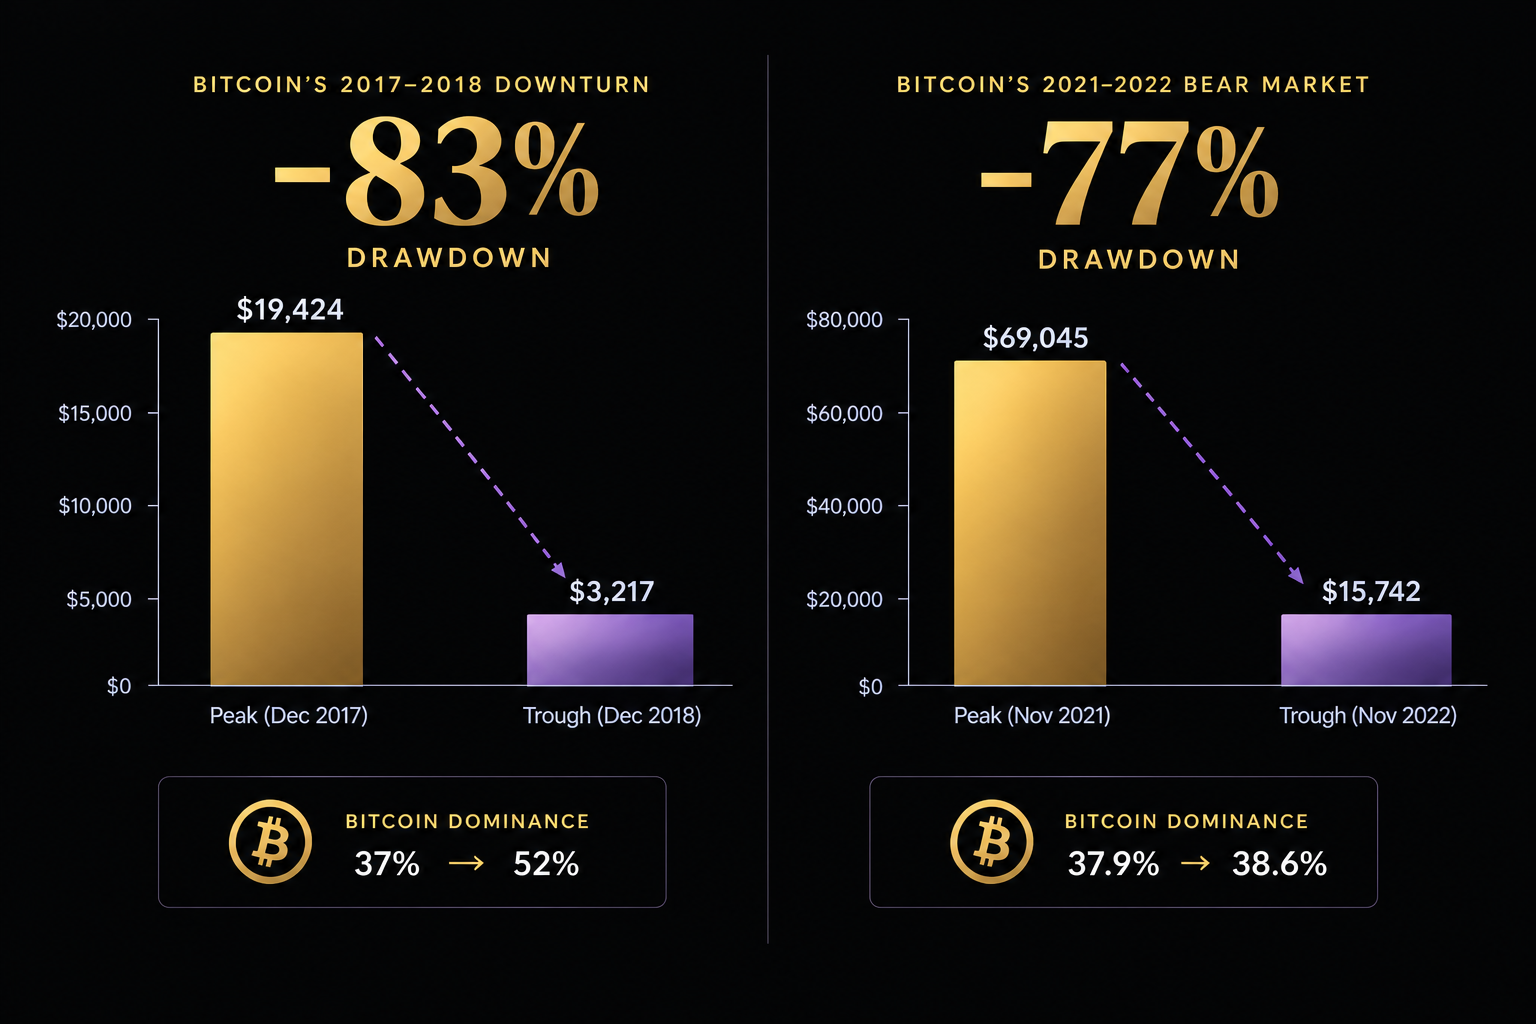 Quick Answer
Major Takeaways
How a Bear Market Is Actually Defined
The Signals Worth Checking: Trend, Breadth, Dominance, Drawdown
Correction vs Bear Market: Where the Line Sits
Why Nobody Calls the Bottom in Real Time
What Historically Changes in a Bear Market
Using XXKK Data to Track Bear Market Conditions
Conclusion
FAQs
How do you define a bear market?
What signals show crypto is in a bear market?
How long do crypto bear markets last?
What is the difference between a correction and a bear market?
