RSI Indicator: Overbought, Oversold, and Divergence
RSI Indicator: Overbought, Oversold, and Divergence
The RSI indicator measures momentum on a 0-100 scale. Learn to read overbought and oversold levels, spot divergence, and avoid common mistakes.
 Quick Answer
RSI, or Relative Strength Index, is one of the widely recognized indicators used by market traders. The indicator functions as a momentum indicator and works in the range that spans from 0 to 100. A reading above 70 could reflect the overbought condition of the asset. In the other case, if the value is less than 30, the asset will be in the oversold category.
The traders can also have a glance for divergence between the asset’s price and RSI, and in some cases, it may indicate a loss of momentum. This indicator works better when it is leveraged with the structure, and newbies must avoid using it as a sole indicator.
What Is RSI, and What Does It Measure?
J. Welles Wilder developed the indicator in 1978. RSI measures average gains against average losses over a lookback window, 14 candles by default, and compresses the numbers into a 0-100 range. The calculation: RSI = 100 - 100 / (1 + RS). Breaking down the formula, RS represents the value of average gain divided by average loss.
The important factor is how to read that line. In times of gains domination, the indicator starts to rise towards 100, and the opposite happens when the price of the relative asset drops. A reading around 50 points out the balance that exists between buyers and sellers. In simple words, the RSI interpretation is simple: it indicates how much momentum currently benefits buyers or sellers and also the strength.
How to Read Overbought and Oversold Levels
RSI over 70: Price has moved up relatively faster than its recent lows. The number of buyers could be extended. However, this does not mean the price has to decline. It just means the move is extended, and it makes a high chance of a correction in the asset's price.
RSI below 30: Price has fallen rapidly. Selling pressure may be at a climax. The important thing to note here is that it is more of a warning, and relying on this just as a confirmation is not recommended.
Practical refinements:
Tame levels to volatility: Crypto assets tend to move more than most assets. Traders may require an 80/20 to screen out the smallest extremes.
Look for exit, not entry: RSI crossing back to below 70 or back up above 30 indicates the momentum is changing.
50 Level: During uptrends, RSI will usually stay above 40 to 50 during pullbacks. During downtrends, RSI will usually fail near 50 to 60. Use these to confirm trend direction.
RSI Divergence: Bullish and Bearish Signals
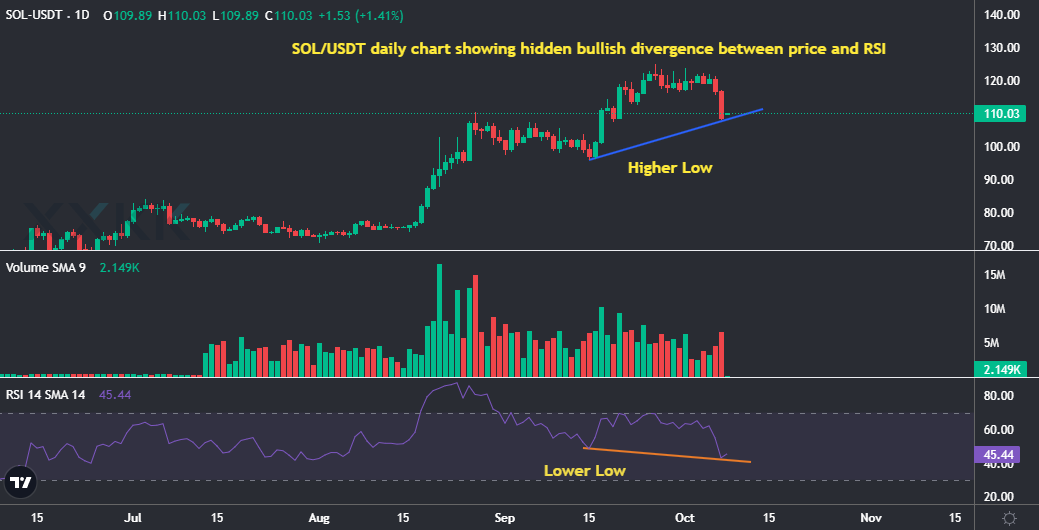
Divergence is when price and RSI are moving in opposite directions. Price makes a higher high, and RSI makes a lower high; the situation is termed bearish divergence.
In the other case, buyers are still willing to pay up but are losing steam. Price makes a lower low, and RSI makes a higher low, and this is the concept of bullish divergence. Sellers are still willing to push but are losing steam.
Let all of it serve as a warning. Divergence may print out three times, and the trader who goes on the first one generally is the one who ends up paying for it. Wait for the confirmation of a support or resistance level break or a trendline break.
RSI vs. Stochastic RSI: Which Momentum Tool to Use
The responsibility of stochastic RSI is to show where the RSI currently sits within its recent range. The range spans from 0 to 100. A figure above 80 signifies an overbought situation for the relative asset; on the other hand, a reading below 20 represents an oversold condition for the same.
Use the regular RSI for the calculation of divergence and the overall trend. The stochRSI helps with the entry within a pullback or in the range formation.
Why RSI Gives False Signals in Strong Trends
The RSI can sustain the rating above 70 during a strong rally, and this can even stay for weeks. In the following case, the price continues with the uptrend. Anyone selling overbought prints could get out too early or short into strength. Same with big sell-offs from below 30.
To utilize RSI in the most efficient way, the market participants should follow these habits:
1. To begin with, one must have an idea about the trend: this could be a moving average or a series of higher highs and higher lows. In the case of an uptrend, oversold dips are considered one of the most useful signals.
2. Take a higher time frame into consideration: A 15-minute overbought reading possibly holds little relevance if we put it into comparison with a daily uptrend.
3. You must have multiple confirmations: Make use of RSI with support and resistance, or leverage it with volume.
Using XXKK Charts to Read RSI
Run a pair from XXKK Markets, incorporate RSI from the indicators menu, and define the period and levels of your timeframe and the volatility of the asset. Then:
Start by marking the important support and resistance levels of the asset.
Go to the indicators tab and add RSI (14) to see if it is above/below the level of 50.
Try to look for divergence at those price points.
In addition to this, make use of stochastic RSI for a more refined setup.
Read the RSI and candlestick price structure on XXKK before we enter any trade.
Conclusion
The simplicity of this indicator is what makes RSI secure its place among the top indicators. The real value is further added by the context. The extremes are respected by ranging markets. The concept of divergence reflects the fading momentum on either side. The speed is added by stochastic RSI. Some of the concepts get broken when the asset follows strong trends.
Ready to start your trading journey? Sign up today with XXKK
FAQs
What does RSI stand for?
RSI, or relative strength index, is a momentum-measuring indicator that was developed back in 1978 by J. Welles Wilder. The purpose of the tool is to measure the momentum at which prices are fluctuating.
What does an RSI above 70 mean?
The reading above 70 indicates that momentum is strong and the market is in overbought territory. Indicates the move is overextended, not that it must reverse, and that in a strong uptrend, RSI can remain well above 70 for a long period of time.
What is RSI divergence?
Divergence starts forming when the price and RSI are trending in opposite directions. For example, if any asset’s price makes a higher high but the RSI forms a lower high, the divergence can be called a bearish one. When the price forms a lower low but the RSI attains a higher low, then the divergence is bullish.
What is the difference between RSI and stochastic RSI?
The price momentum is measured by utilizing RSI. The concept of Stochastic RSI is the stochastic calculation applied to RSI indicator values, and this is what makes it a faster indicator and therefore produces more signals.
