SUI Coin Gain or Loss: Net Gain After Costs
SUI Coin Gain or Loss: Net Gain After Costs
Calculate SUI coin profit or loss from buy and sell prices, including fees, spread, and net ROI, using a $0.81 SUI reference price.
Quick Answer
Gain or loss calculation on SUI coin is based on the comparison of cash invested at the buy price with the cash realized at the sell price after fees and slippage, or any other cost considerations. At the price point of $0.81 as the reference entry point for SUI, a $1,000 trade position could bring in around 1,234.57 SUI before any relevant costs 2., and could create a gross profit of $234.57 with a selling price of $1.00. Point to remember: while entering any trade position, the actual quantity and returns are generally lower when cost considerations are followed.
Key Takeaways
-
The formula is Net profit = sale proceeds - purchase cost - total trading costs.
-
At the reference point of $0.81 before fees and costs, $100 will amount to 123.46 SUI; $500 will amount to 617.28 SUI and $1,000 will amount to 1,234.57 SUI.
-
Percentage of net profit does not equal a higher sell price, as trading costs and taxes could reduce the actual realised return.
-
Break-even will take place above the original buy price due to the inclusion of entry and exit costs.
-
SUI has exposure to volatility in price, which can go downwards and upwards both ways.
 SUI buy and sell price scenarios.
What Is SUI Coin?
SUI coin is the native token of the Layer 1 Blockchain, Sui. The mainnet of Sui was launched on 3rd May, 2023. As per the official token supply page of Sui, SUI is used for on-chain transactions, gas network fees, network security, and liquidity, with a max supply capped at 10 billion tokens.
Based on the network's tokenomics documentation, it can be said that SUI is an asset used for on-chain governance along with fulfilling staking requirements. These functions do not completely define the market price, but they resonate with SUI's role within the network.
How to calculate SUI coin gain or loss
A SUI profit calculator needs four core inputs: the amount invested, buy price, sell price, and total costs. The actual token quantity should be calculated first.
Step 1: Calculation of SUI purchase
Use:
SUI quantity = investment amount ÷ buy price
At a $0.81 buy price:
-
$100 ÷ $0.81 = 123.46 SUI
-
$500 ÷ $0.81 = 617.28 SUI
-
$1,000 ÷ $0.81 = 1,234.57 SUI
These figures don't account for fees and other expenses. XXKK Exchange's SUI price conversion tool helps determine the comparison of SUI with other value assets before a trade.
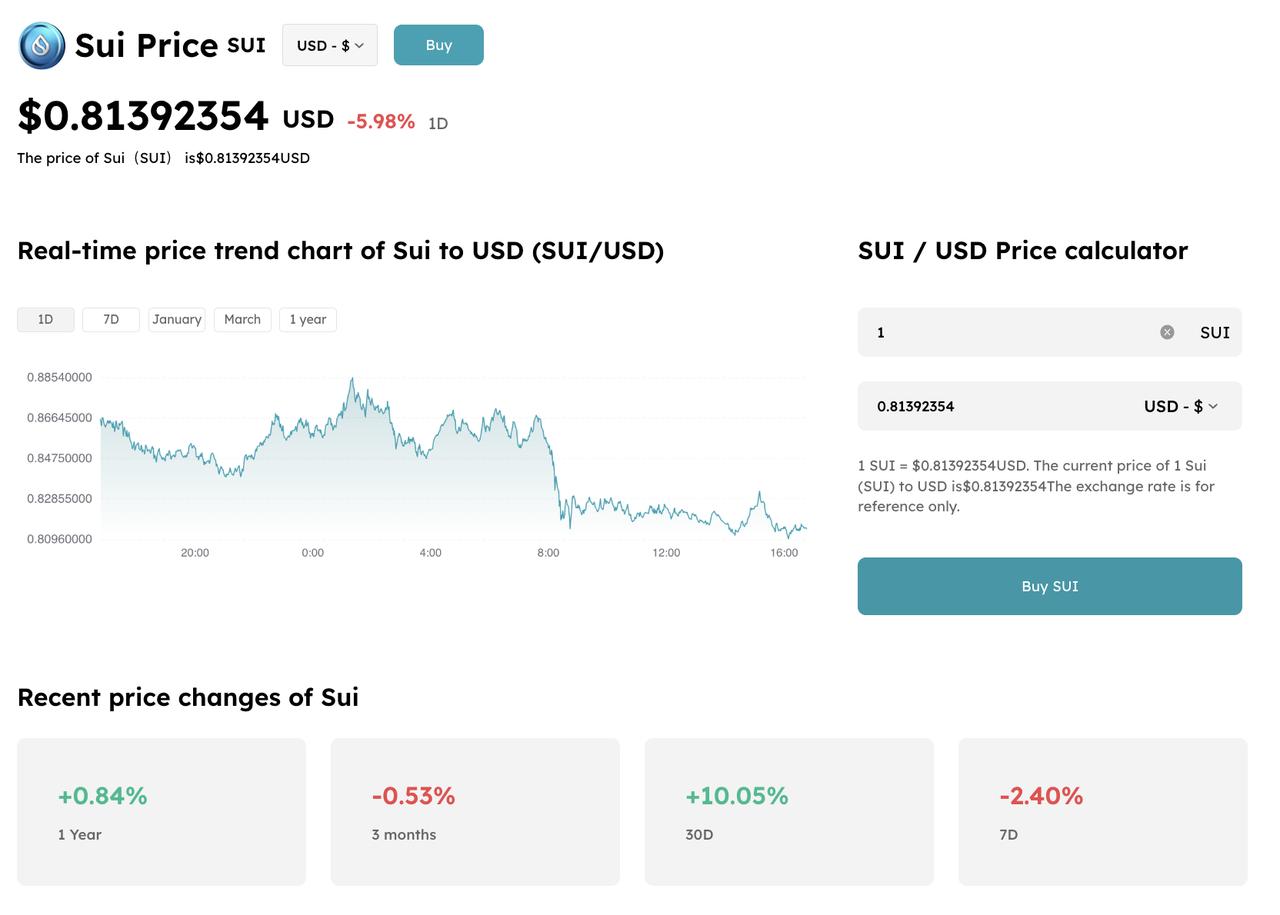 SUI price chart with live USD conversion data.
Step 2: Calculation of Gross Sale
Multiply the total SUI tokens by the assumed sale price:
Gross sale value = SUI quantity × sell price
$100 would bring around 123.46 SUI; at a sale price of $1.00, the gross sale is about $123.46. Similarly, at $1.20 it would be worth about $148.15.
Exit costs can cause a mismatch between gross value and net proceeds.
Step 3: Reduction of entry and exit costs
Trading fees of the exchange, spread between ask-bid prices, slippage, payment fees, card fees, along with withdrawal from the blockchain or charges of transfer whenever applicable constitute the costs of making a trade on SUI.
These charges vary from platform to platform and also based on the transaction method.
Use:
Net profit = gross sale proceeds - original cash outlay - total costs
If the combined cost is assumed at $2.00, on a trade position of $100.00, the net profit is about $21.46 instead of gross profit of $23.46.
Step 4: Calculation of net ROI
ROI helps to ascertain profit or loss as a percentage for easy decision-making.
Net ROI = net profit ÷ original cash expenditure × 100
With a $21.46 net profit on a $100 trade position:
$21.46 ÷ $100 × 100 = 21.46%
To make such calculations simpler, a trader may use XXKK's SUI ROI calculator. This tool helps with scenarios based on different mathematically possible calculations and must not be considered a prediction of SUI's future price or order execution at entered values.
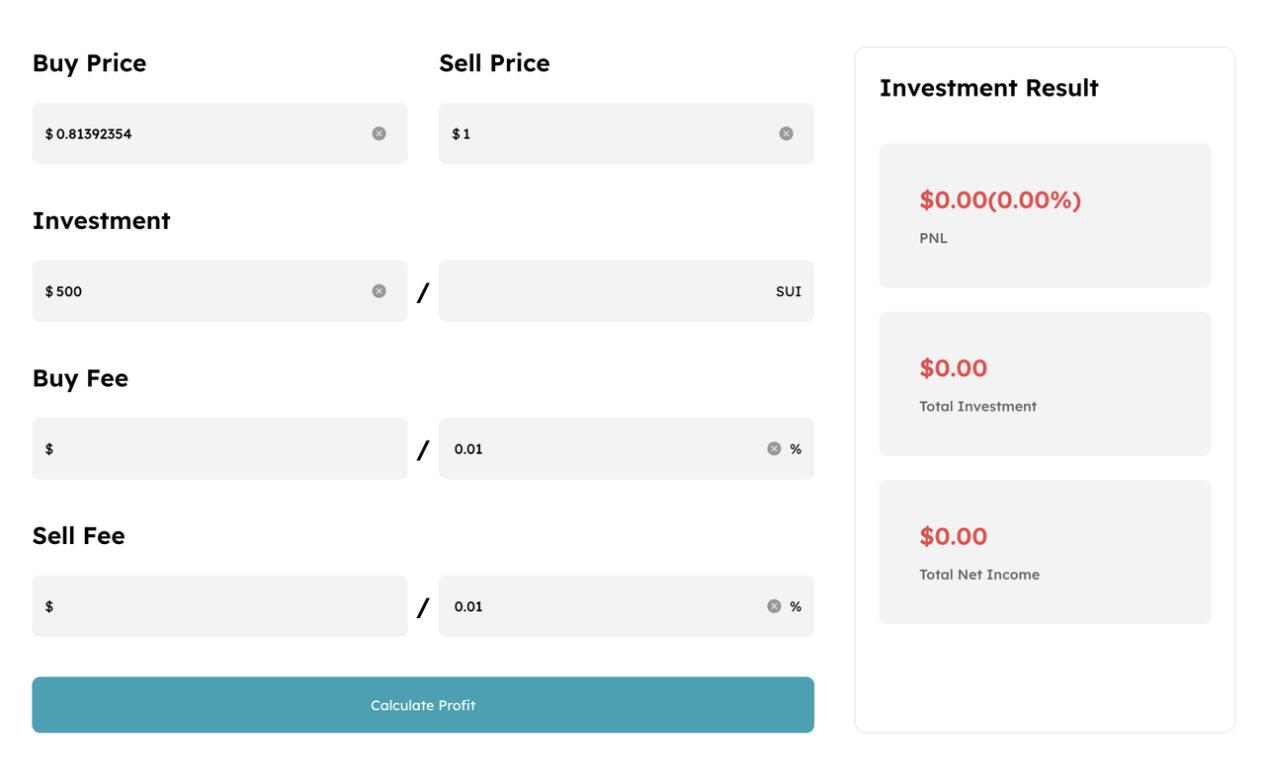 SUI profit calculator for estimating returns from buy and sell prices.
SUI Gain and Loss Scenarios at $1,000
The following table assumes an investment of $1,000 at the price reference point of $0.81, with a 0.10% entry and exit trading fee, and both sides have adverse slippage of 0.20%.
The following are hypothetical conditions framed for illustration of different conditions. No exchange fees or terms of execution are guaranteed. After the assumed entry costs, the reference trade position is about 1,230.86 SUI.
| Sell price | Net proceeds | Net gain or loss | Net ROI |
|---|---|---|---|
| $0.50 | $613.59 | -$386.41 | -38.64% |
| $0.81 | $994.02 | -$5.98 | -0.60% |
| $0.80 | $981.74 | -$18.26 | -1.83% |
| $1.00 | $1,227.18 | $227.18 | 22.72% |
Click the image to view the sheet.
If the sale is made at the same quoted price, there would be a $5.99 loss due to applied costs on both sides. To continue with these assumptions, the break-even selling price would come near the level of $0.8149.
These calculations are based on stated rates with rounded figures for easy readability. Break-even price could be increased if there is a larger spread, exit cost, or market impact.
Why Actual SUI Profit Can Be Different from Calculations
The chances of a real trade realising at the theoretical price are based on the execution of the trade. Speed can be delivered by market orders but may not fulfill the desired price. Maximum buy price or minimum sell price comes under the control of limit orders, but there are high chances for them to remain unfilled. Taxes cannot be ruled out from profit realization based on the local jurisdiction.
Long-term returns can also be derived from the factoring of the supply of tokens. According to the token schedule of SUI, the max cap is at 10 billion SUI, but currently only a fraction of total tokens are in circulation. According to the staking explanation from Sui Foundation's official sources, emission schedules can be helpful in understanding how stake subsidies enter circulation.
Layer 1 network using the Move language for an asset-oriented model is what best describes Sui, according to official documentation.
SUI demand is highly correlated with the activities taking place on the network, because the SUI token is used for staking and for paying gas fees to run the activities, but network development and growth in applications don't guarantee any price uplift.
Risks while calculating SUI returns.
The largest visible risk for assets like SUI is volatility. Slippage can always widen, liquidity can disappear, failures in the execution of smart contracts, network collapse, or failure at the level of exchange execution. Counterparty activities and the regulatory environment can also affect the access, withdrawal, or value of SUI.
The next frontier is the custody decision. A retail crypto custody bulletin from the SEC clearly explains how self-custody makes owners responsible for their own private keys. On the other hand, it's not difficult to say third-party custody brings provider risk.
Never share seed phrases with anyone; always verify the addresses of recipient wallets by making a small test transaction before making a major transfer.
Net-Gain Takeaway for SUI Coin
Performance of SUI coin is based on the measurement of the difference between entry position spending and actual sales value from exit.
A $1,000 position purchased at $0.81 and sold at $0.80: the estimated net loss comes in the vicinity of $18.26 under the above-discussed assumptive examples.
Always verify live prices on the market, including real costs and fees along with the appropriate structure of taxation. Before making an investment or making a commitment of capital to any trade, always make a well-thought-out plan for exit.
A calculator is just a planning aid. Before executing an order, make sure to confirm every detail and risk only that part of capital that you are ready to lose entirely. Future results are not guaranteed by past performance; all discussed calculations are not personalized advice that is financial in nature.
FAQs
How do buy and sell prices help with SUI profit calculations?
Buy prices, when subtracted from sell prices after adjustment of all fees, costs, and other considerations, will tell the net profit made on the trade of SUI.
How much SUI can be purchased with $1,000 at a buy price of $0.81?
Approximately 1,234.57 SUI before fees and other cost considerations can be purchased for $1,000. When cost considerations are put into the equation, the buying fee at 0.10% and entry slippage at 0.20%, the expected quantity of SUI tokens decreases to 1,230.86 SUI.
What is the break-even price for SUI Coin after costs?
Under the assumptions of the above-discussed examples, the break-even price would be approximately $ 0.8149. Break-even price levels will change with respect to any changes in purchase and sell fees, spread, slippage, or any other related costs.
Does a SUI profit calculator make returns predictions?
No, only assumptive scenarios can be tested with the help of a calculator; it cannot forecast SUI's price, liquidity in the future, quality of execution, availability on the platform, and any regulation or tax treatment.
Why is the SUI price gain higher than net profit?
Not only is the simple price change percentage well adjusted within the net profit calculations, but it also accounts for trading fees, spread, slippage, charges for withdrawal, and taxes.
