Wyckoff Accumulation – Phases of Wyckoff Accumulation and How to…
Wyckoff Accumulation – Phases of Wyckoff Accumulation and How to Recognize Them
Wyckoff accumulation describes how large buyers build positions without moving price. Learn the phases, volume clues, spring and test, and schematic.
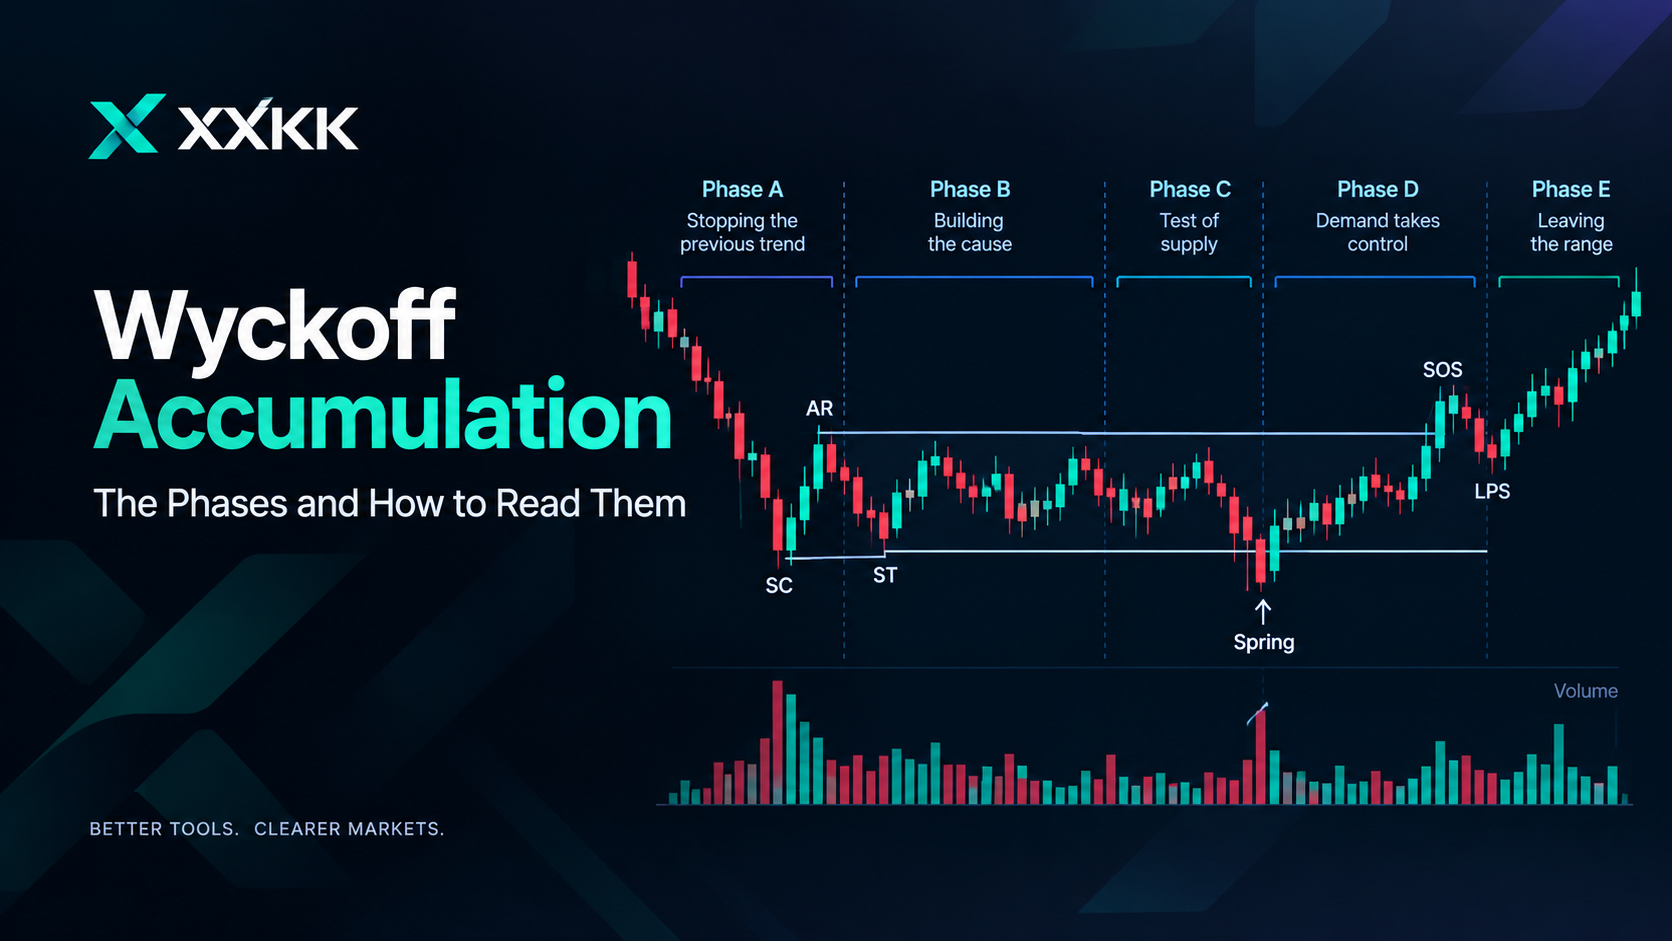
As we all know, markets don't go in straight lines. In fact, many times before prices take off for an extended rally, they will trade within a horizontal band (sideways) for several weeks or even months as buyers and sellers fight each other in a specific price area. This lateral movement might seem like nothing is happening to a trader who only looks at the very next candlestick; however, from the perspective of Wyckoff Accumulation, the lateral band can provide valuable insight into how supply and demand are evolving.
The Wyckoff Method is a structure that can be used to study price behavior within the boundaries of those patterns. Traders do not view the Wyckoff Method as a forecasting device; instead, they treat the Wyckoff Method as a means to understand how prices are moving.
What is Wyckoff accumulation?
Wyckoff Accumulation Is A Market Condition Where Major Investors Are Believed To Be Acquiring Stock While Prices Remain Within A Trading Range.
The concept was taken from the work of Richard D. Wyckoff regarding how markets behave. He used a methodology that was based upon the relationship of price and volume; as well as the balance of supply and demand.
An example of a common accumulation area is when price has declined significantly. The selling pressure has diminished significantly; however, this doesn't guarantee that price will increase. Traders continue to monitor the action of the market at critical levels in the accumulation area.
Interestingly, this is where the Wyckoff pattern comes into play. Here, it allows you to tie together what you have just seen: selling climaxes, tests, springs and breakouts.
The important distinction is that the pattern describes a market behavior; it does not guarantee what happens next.
The Phases of Accumulation, Phase A Through Phase E
The Wyckoff accumulation process consists of five phases. Not every market will follow the textbook sequence exactly but the phases can be used to analyze a range.
Phase A: Stopping the Previous Trend
Phase A is the stage where the previous downtrend stops.
A Selling Climax (SC) may occur as selling causes the price to decline drastically. This can be followed by an Automatic Rally (AR) as the selling stops and buyers step in.
The stock market responds by conducting a Secondary Test (ST) in the area near the selling peak. Do the shares again sell at the same rate, or are there signs that the stock market is becoming less supplied?
Phase B: Building the Cause
Phase B is generally the longest.
Price bounces back and forth between the range and the market also creates a “cause” for a move later. Supports and resistances are tested several times.
Volume is particularly useful here. Responses of high volume near the edges of the range can indicate where the market is most interested, although volume should always be viewed in conjunction with price action rather than alone.
Phase C: The Test of Supply
Phase C is where the market may produce one of the most recognisable features of the Wyckoff accumulation diagram: the spring.
A spring occurs when price briefly moves below an established support area before returning into the range.
The sudden move might shake traders with long positions or trigger short selling, but what happens next?
A spring by itself does not indicate accumulation. Traders look for a following test suggesting that selling pressure has decreased.
Phase D: Demand Takes Control
If the range is built as an accumulation structure, Phase D could show growing demand.
Price may then form a Sign of Strength (SOS) and move toward the upper end of the range. Pullbacks known as Last Points of Support (LPS) may remain at higher levels.
The first observation to make is the relationship between advances and reaction. Higher moves upward accompanied by a supportive volume can suggest that demand is becoming more active in the structure.
Phase E: Leaving the Range
Phase E is the transition from the range into the new direction.
Price breaks out of the range and begins to move outside. At this point, it is easier to recognize the accumulation pattern in retrospect than as it is still developing.
The difference is important because traders analyzing a live chart do not know which phase will come next.
Reading the Accumulation Schematic: Spring and Test Usually because it's unique, the spring is the focus of attention.
Imagine a range where there is a support level clearly defined and prices suddenly decline below the support level, giving the appearance of a break-out. The support level does not continue to go lower but quickly returns to the range.
The next step is the test. The test asks if sellers can reproduce the same downside pressure. If price re-enters the spring area but the selling volume and momentum on the downside are noticeably lower, that may further confirm that supply has increased.
But not every break below support is a spring, some are just real breakdowns.
So a Wyckoff accumulation schematic should also be looked at as a context-setting system, not as a set of signals to follow.
If you have just started charting as a trader or are still learning how charts work, it is highly important that you understand what candlesticks are and what they mean, to get a better understanding of how the wyckoff accumulation works. See XXKK’s Candlestick Chart Basics for an update on open, close, high and low prices.
Accumulation vs Distribution: The Same Map, Inverted Accumulation is related and works hand-in-hand with the Wyckoff distribution.
Accumulation refers to a range of prices that may form after a fall, where demand will gradually overtake supply. Distribution refers to a range that may arise after a rise, where supply will increasingly overtake demand.
These can look very similar at first.
Distribution may include the event of an Upthrust After Distribution (UTAD), a type of spring, which occurs above resistance rather than below support. Rather than viewing this move as an isolated signal, it is worth looking at what happens following the breakout attempt.
So it’s not just whether the price rises above or below a level. It's also about context, volume, subsequent tests and market reaction to those events.
Volume Clues and Common Misreads
Volume is one of the most important elements of the Wyckoff approach, however, it is easy to overinterpret.
A large volume bar is not always an accumulation. A large volume bar shows that there was a large amount of activity as price action also helps in providing context.
Some of the mistakes traders make are:
1. Treating every sideways market as accumulation.
2. Assuming every break below support is a spring.
3. Calling a pattern complete before it is confirmed.
4. Looking at volume without considering where it occurred.
5. Fitting the live price action into a textbook schematic.
6. Ignoring the overall market trend.
The right questions to ask instead are:
1. Where is the price point within the range?
2. How does it react at support and resistance levels?
3. Is volume expanding or contracting?
4. Does a breakout hold or does price immediately return to the range? Using XXKK Charts to Track Accumulation Ranges
Live charts make it easier to understand how a range grows over the course of time. On XXKK Markets, traders can observe price structure and volume, while also paying attention to potential support and resistance levels.
Instead of labeling every candle, mark the obvious boundaries of the range. Watch how price behaves when it nears those levels.
The retest of the range low can be quite informative. Does price fall through support and bounce? Do sales increase wildly? Will the next test show less selling pressure than the previous one?
These observations might help to explain the Wyckoff pattern.
If you want to study range behaviour on live charts, open an XXKK account and follow the price-volume interaction on the charts over time.
Conclusion
Wyckoff accumulation is a way to read the structure of the markets and not a forecasting methodology.
Its five phases (A-E) help to determine the pattern of trading ranges while events such as the spring and test can shed light on supply and demand.
Volume is another thing to consider, but volume alone should not be taken as the only thing that matters. The same applies when looking at accumulation or distribution: the structure, context and the price behavior are critical.
Remember that it is best to wait when studying a potential accumulation setup. Watch the range, monitor volume change around key levels, and wait for confirmation before placing your order.
FAQs
What is Wyckoff accumulation?
Wyckoff accumulation is an analysis that enables one to examine the changing behaviour of a range of prices, whereafter a decline in prices supply has been absorbed by demand. It uses price action and volume to study change in market behavior.
What are the phases of Wyckoff accumulation?
The five phases are:
1. Phase A, when the trend starts to break down
2. Phase B, when the trading range develops
3. Phase C, which may include a spring and test
4. Phase D, when demand will become apparent
5. Phase E, when price leaves the range.
How do you read a Wyckoff schematic?
Begin with examining the range boundaries and watch the sequence of price and volume events. Watch for tests of support and resistance, springs, signs of strength and how price behaves after each event.
What is the difference between accumulation and distribution?
Accumulation is the result of a range that has formed after a decline, whereas distribution is a range that can emerge after an advance. The two structures have some similarities, but the trend and supply-demand interactions can provide a context.
How do you trade a Wyckoff accumulation setup?
With the range based on confirmation such as a spring, test, sign of strength or successful retest, the trader should look at the evidence not presume that a textbook pattern will ensure an outcome. Inspecting volume as price retests a range low can provide additional context and waiting for confirmation will help protect against trading on an unconfirmed pattern.
