TSMC (TSM) Stock Price: Live Chart & Trading Guide
TSMC's share price tracks advanced-node demand and foundry pricing. See the live TSM stock chart, the drivers, and how to trade it on XXKK.
Quick Answer
The TSM stock price, as of the 23rd of October 2026, at 4:00 p.m. ET, was $414.90. At the close of the market, the price was down by $16.87. The price was a 3.9% decline from the closing price on the 22nd of October 2026.
The TSM stock price in this article is not the current price in the market. Please check the stock’s live price on the XXKK market before trading.
Major Takeaways
TSMC's foundry market share is 73%. The company has remained in that leading position for two quarters in a row.
The TSMC earnings drove the company’s net profit to a 68.7% year-over-year increase.
The company expects its Q4 revenue to reach between $52.3 billion and $54.3 billion. Management, based on the data in its recently released report, has raised the company’s 2026 growth outlook to around 44%.
TSMC released its Q3 report on the 15th of October 2026.
What the TSMC Share Price Represents
The Taiwan Semiconductor Manufacturing Company (TSMC) is the single largest player in the world’s dedicated semiconductor foundry.
The TSM share price represents the value of a share of this semiconductor manufacturing giant in the stock market. For more market information, visit XXKK Markets.
The US-listed TSM ticker is an American Depositary Receipt (ADR). The ticker represents an interest in TSMC shares held through a US depositary bank.
It also allows investors to trade TSMC in the US market in US dollars. However, it is not the same instrument as buying the company’s ordinary shares on the Taiwan market.
See XXKK’s NVIDIA (NVDA) stock price guide for a wider AI demand story.
Foundry Market Share and the Leading Edge
The surge in AI-related demand in Q2 2026 has greatly benefited the pure-play foundry sector. The Q2 revenue of this sector saw a 29% YoY increase.
There has been some imbalance between mature and advanced nodes, and capacity reallocation is the major cause of the imbalance.
TSMC foundry market share stands at 73%, and it has maintained that leading position for two quarters in a row.
The company maintains such heights because of how it mass-produces 2-nanometer (N2) chips, its 3-nanometer (N3) production ramp-up, and how tight its advanced packaging and 8-inch and 12-inch mature node supply is.
TSMC Earnings and Capacity Guidance
The earnings that Taiwan Semiconductor Manufacturing Co. reported in Q3 exceeded the expectations of many analysts. These earnings were driven by the surging global demand for AI chips.
According to the report, TSMC's Q3 revenue was $46.72 billion. The company’s Q3 earnings per share (EPS) in the report was $4.60.
The TSMC earnings drove the company’s net profit to a 68.7% year-over-year increase. The Q3 earnings are the sixth consecutive time the company has posted record-breaking earnings.
The TSMC operating margin also climbed to 58.7%. This increase surpassed the company’s upper-end guidance of 58%.
This solid performance shows how powerful TSMC’s pricing is amid the surge in demand for advanced semiconductors.
The company expects its Q4 revenue to reach between $52.3 billion and $54.3 billion. The average of these figures implies that there will be a 14% increase over Q3 2026 revenue and a 58% increase over Q4 2025 revenue.
TSMC is also expecting its capital expenditure from 2026 to 2028 to surpass, by far, what it has seen in the last three years.
This expectation is coming from the ongoing capacity expansion to meet the rising demand from customers around the world.
TSMC expects that the continuing 2-nanometer ramp-up process and the demand for advanced manufacturing tech will support its Q4 growth.
TSMC Market Cap and Cycle Valuation
The tsmc market cap is $2.138 trillion. The asset, as of the time of this research, was trading at $414.90 with a quarterly EPS of $4.60.
The market cap just tells you the value of a company's stock in the market. It does not give you any information on whether the stock is cheap or expensive.
You can assess TSMC valuation by comparing its forward price-to-earnings (P/E) ratio with its past valuation, the growth of its expected earnings, and similar firms.
Reading the TSM Chart
Here are three major things to watch when monitoring or reading the TSM chart:
The Support and Resistance Levels: Identify these levels to know whether the price will break the asset’s most recent high ($428.21) and low ($416.12).
Timeframes: You can use the short (hours to days) or long (weeks to years) timeframes to know whether the asset is experiencing a pullback from a higher low or is retesting from a lower high.
The Volume Triggers: Look out for any green candle expansions followed by above-average volume. These scenarios confirm that the asset price is going through a reversal from current neutral levels.
Trading TSM Contracts on XXKK
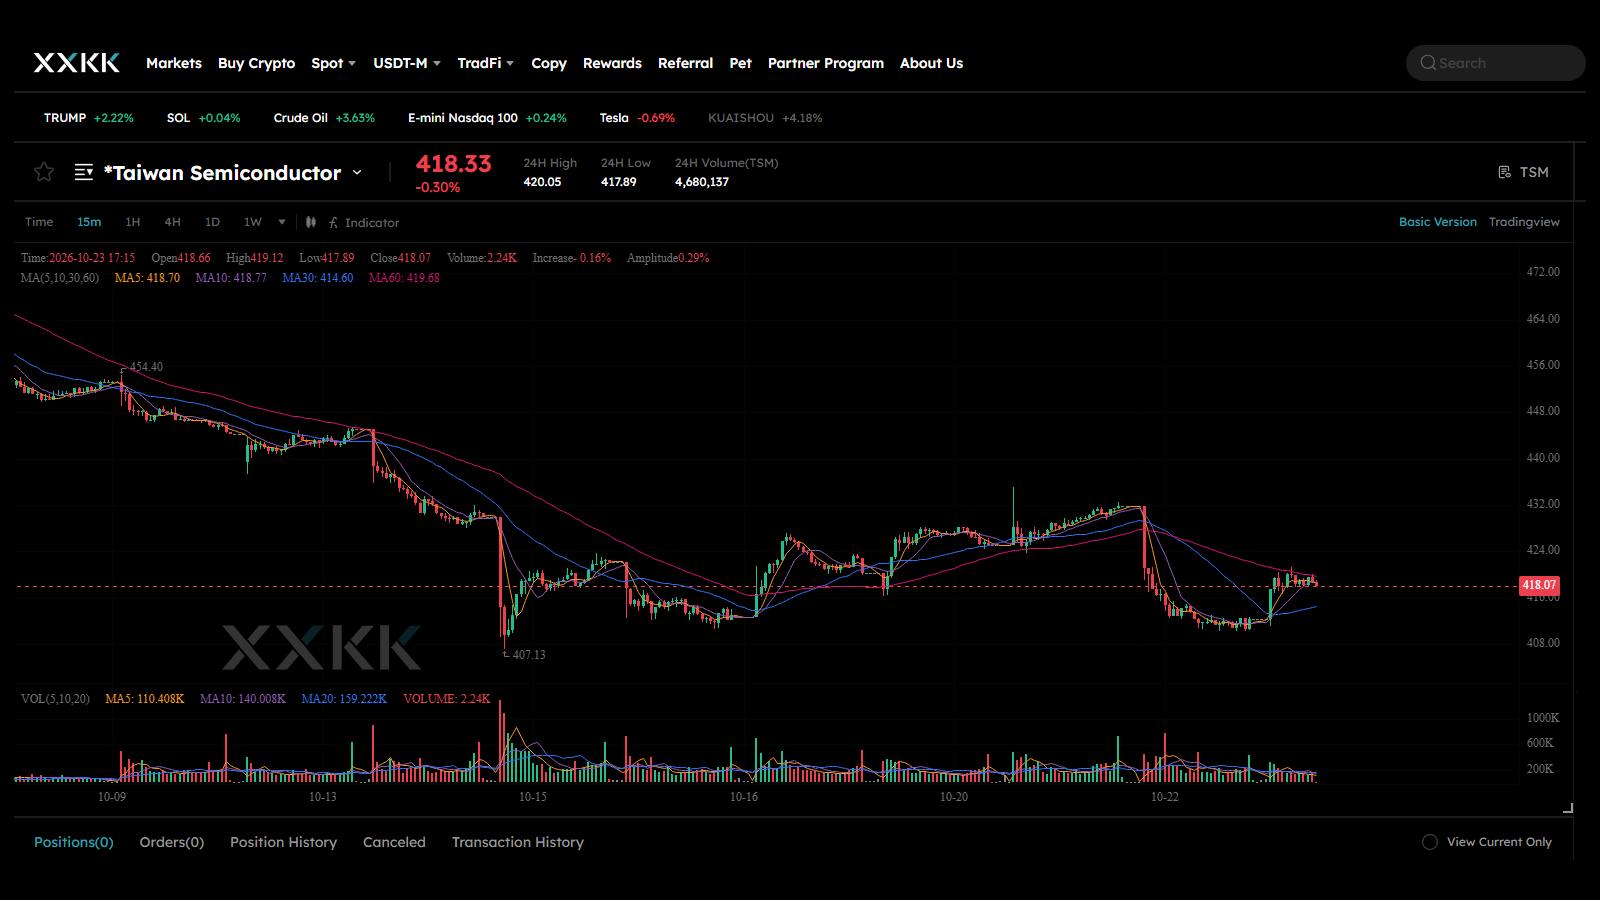
You can trade TSM on XXKK as a contract derivative. The contract exposes you only to price movements, not the actual stock. That means you do not have ownership of any stock or qualify for dividends.
Here is how you can trade the TSM contract on XXKK:
Register on XXKK to open a new account or log in to your existing account.
Fund your account with stablecoins like USDT.
Go to the XXKK TradFi menu and search for TSM.
Set your preferred margin mode, leverage, stop loss, take profit, and the amount you intend to trade with.
Place the trade by selecting short or long.
Conclusion
Many people in the tech community believe that there is a slowdown in AI semiconductor demand that may hit the market soon. This sentiment has led to a recent sell-off.
However, the Q3 TSMC report makes it very difficult to believe such an event may happen. The TSMC earnings performance is a good reflection of the increasing global AI chip demand.
Open an XXKK account to follow the live TSM price and trade it. Check the TSM contract specifications on XXKK before you size a position. Read the monthly revenue release before you trade around the quarter.
FAQs
What is the TSM stock price today?
The current price of TSM stock on the 23rd of October 2026 is $414.90. The TSM price was down by $16.87 from its previous day’s $431.77 close.
What drives the TSMC share price?
At the top of the list of TSMC share price drivers is the increasing demand for AI semiconductor chips.
Why do advanced nodes matter so much?
AI chips run on advanced nodes and TSMC’s is leading this niche. They offer better performance for AI systems, are energy-efficient, and support complex designs.
What is TSMC's market share in foundry?
TSMC holds 73% of the foundry market share.
